Key Findings

 The key findings in the 2022 CAP Enforcement Scorecard demonstrate an overall downward trend in some key areas of clean water enforcement in Maryland over the past 20 years. In the last six years, there has been a dramatic decline in the number of enforcement actions taken by the Water & Science Administration (WSA), the number of sites inspected, and the number of significant violations identified involving environmental or health impacts.
Click here for a larger collection of charts.
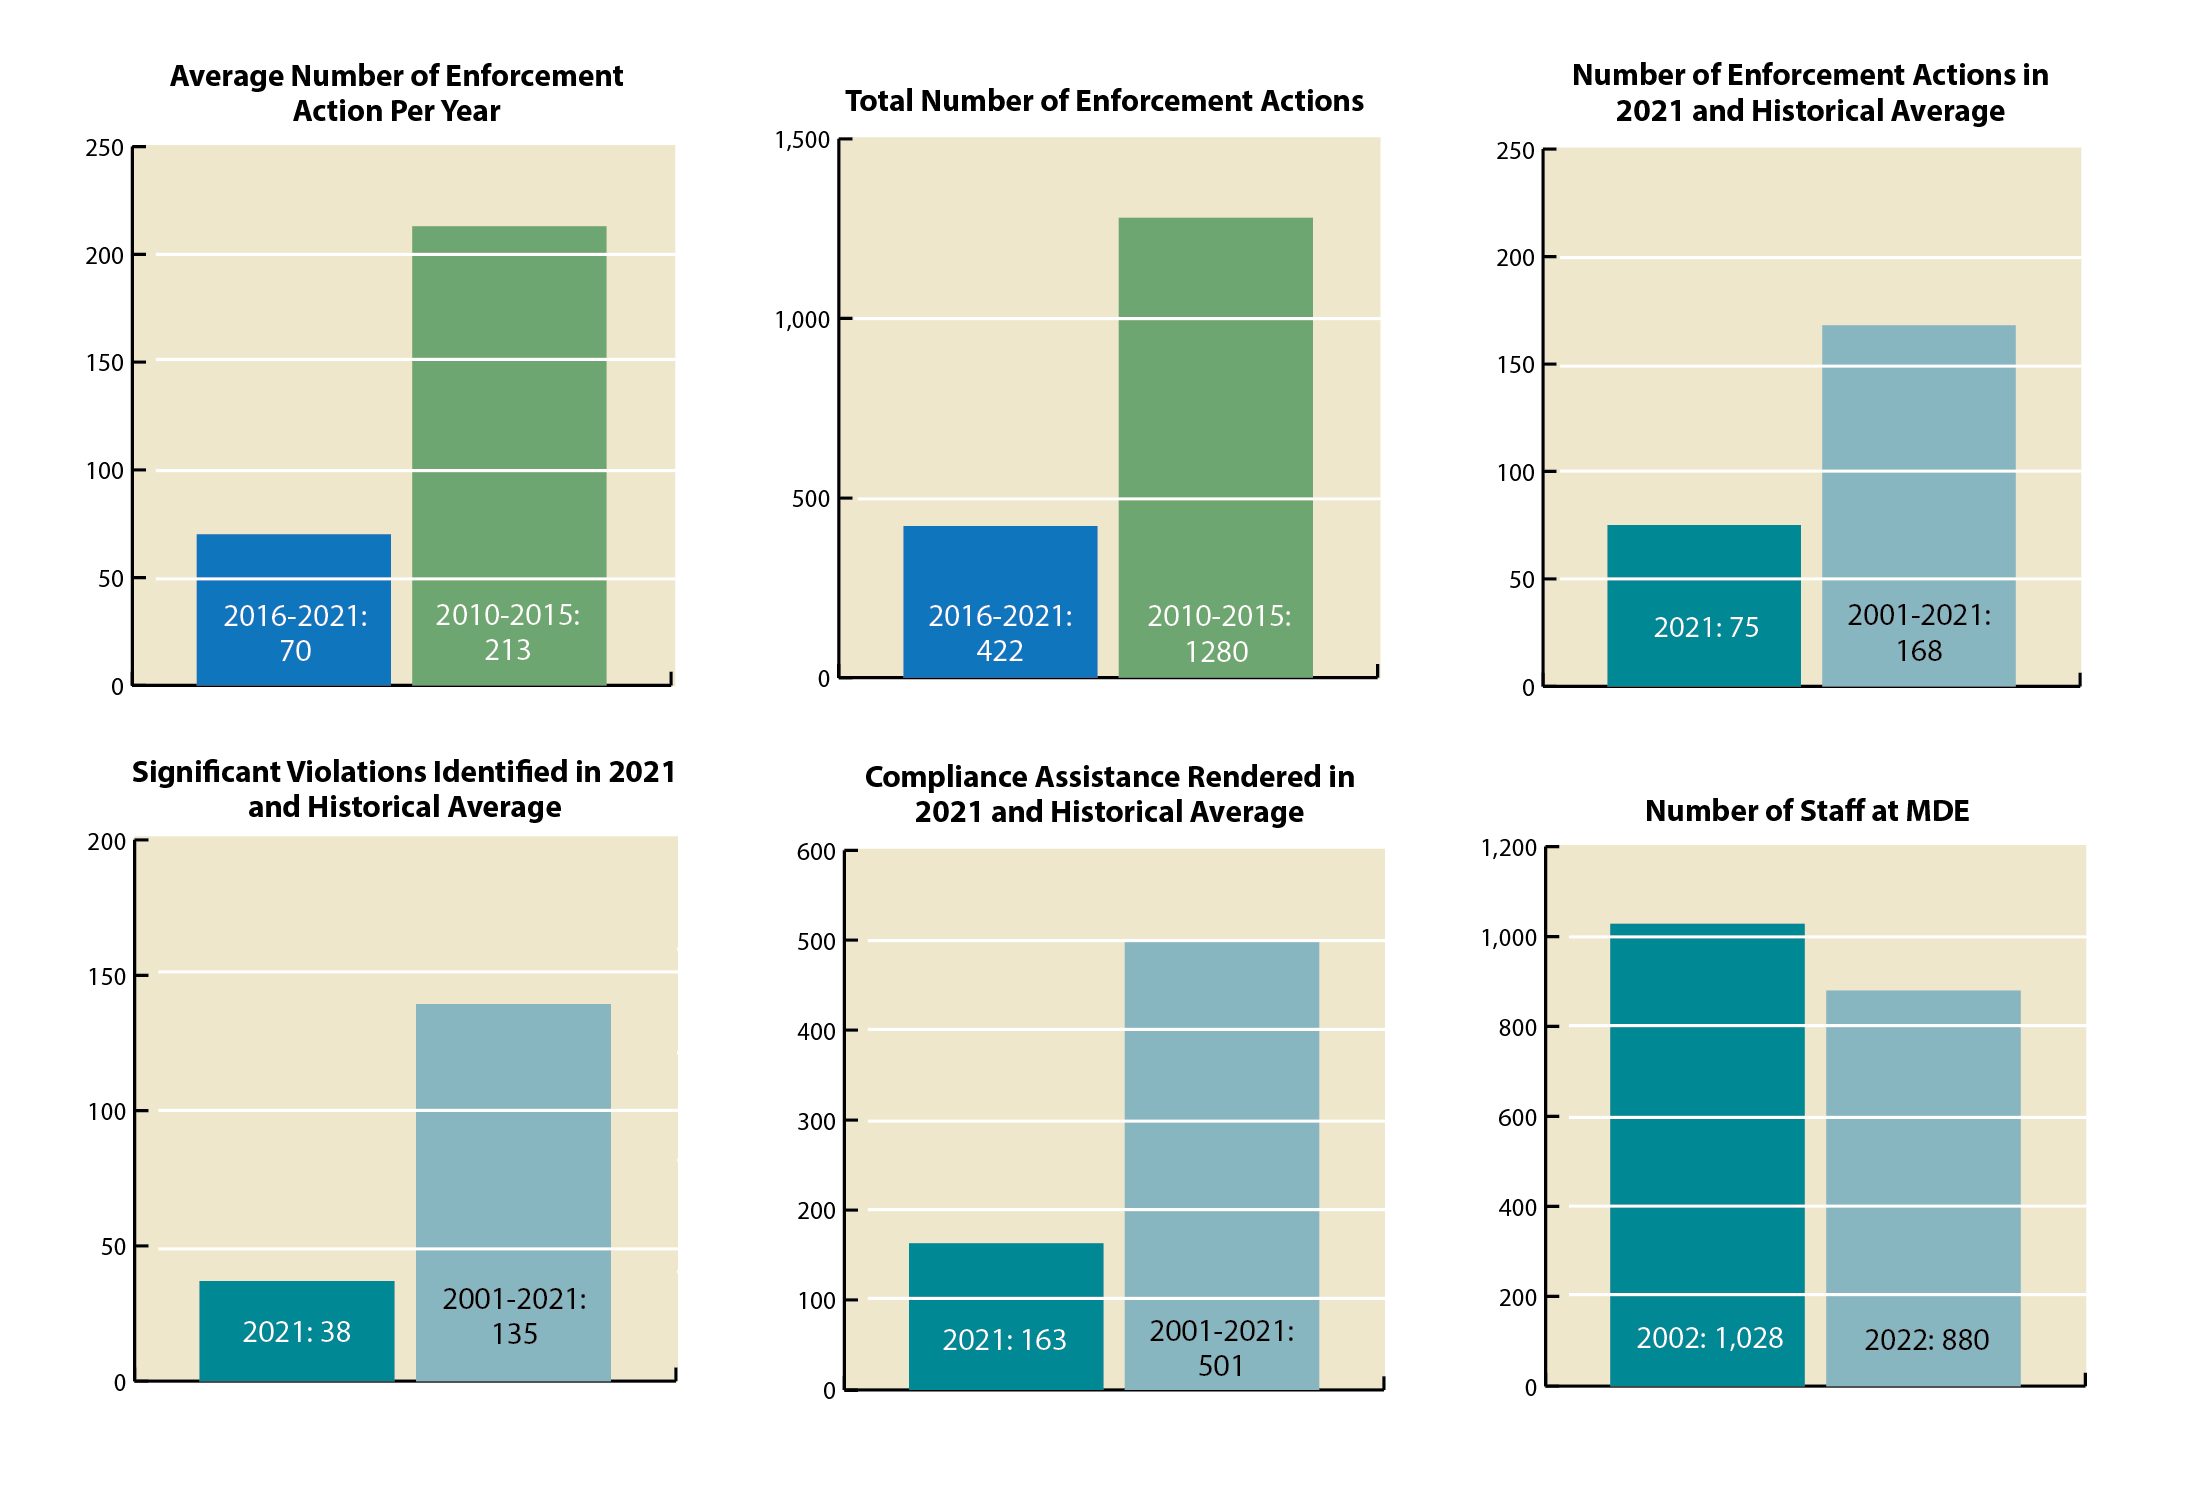
- Overall, from FY2016 through FY2021, WSA took 67 percent fewer water-related enforcement actions than it took from FY2010 through 2015. In total, from FY2016 through FY2021, WSA took 422 enforcement actions and it took from FY2010 through 2015 took 1,280 enforcement actions.
- In FY2021, WSA took 55 percent fewer water-related enforcement actions than WSA’s historical average.
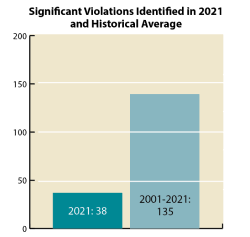 In FY2021, WSA identified 72 percent fewer significant violations involving environmental or health impacts, a record low. In FY2021, WSA only identified 38 of these violations.
- In FY2021, WSA rendered 67 percent less compliance assistance than WSA’s historical average.
In the two decades between fiscal years 2002 and 2022, MDE lost one out of every seven staff, with its agency budget of state general funds falling by more than one-third, adjusting for inflation. MDE now represents less than one-fifth of one percent (0.018%) of Maryland’s total state general fund budget, which is half of what it was two decades ago. At a time when protecting our environment is vitally important, MDE's budget has languished in the overall state budget.