2022 CAP Enforcement Scorecard

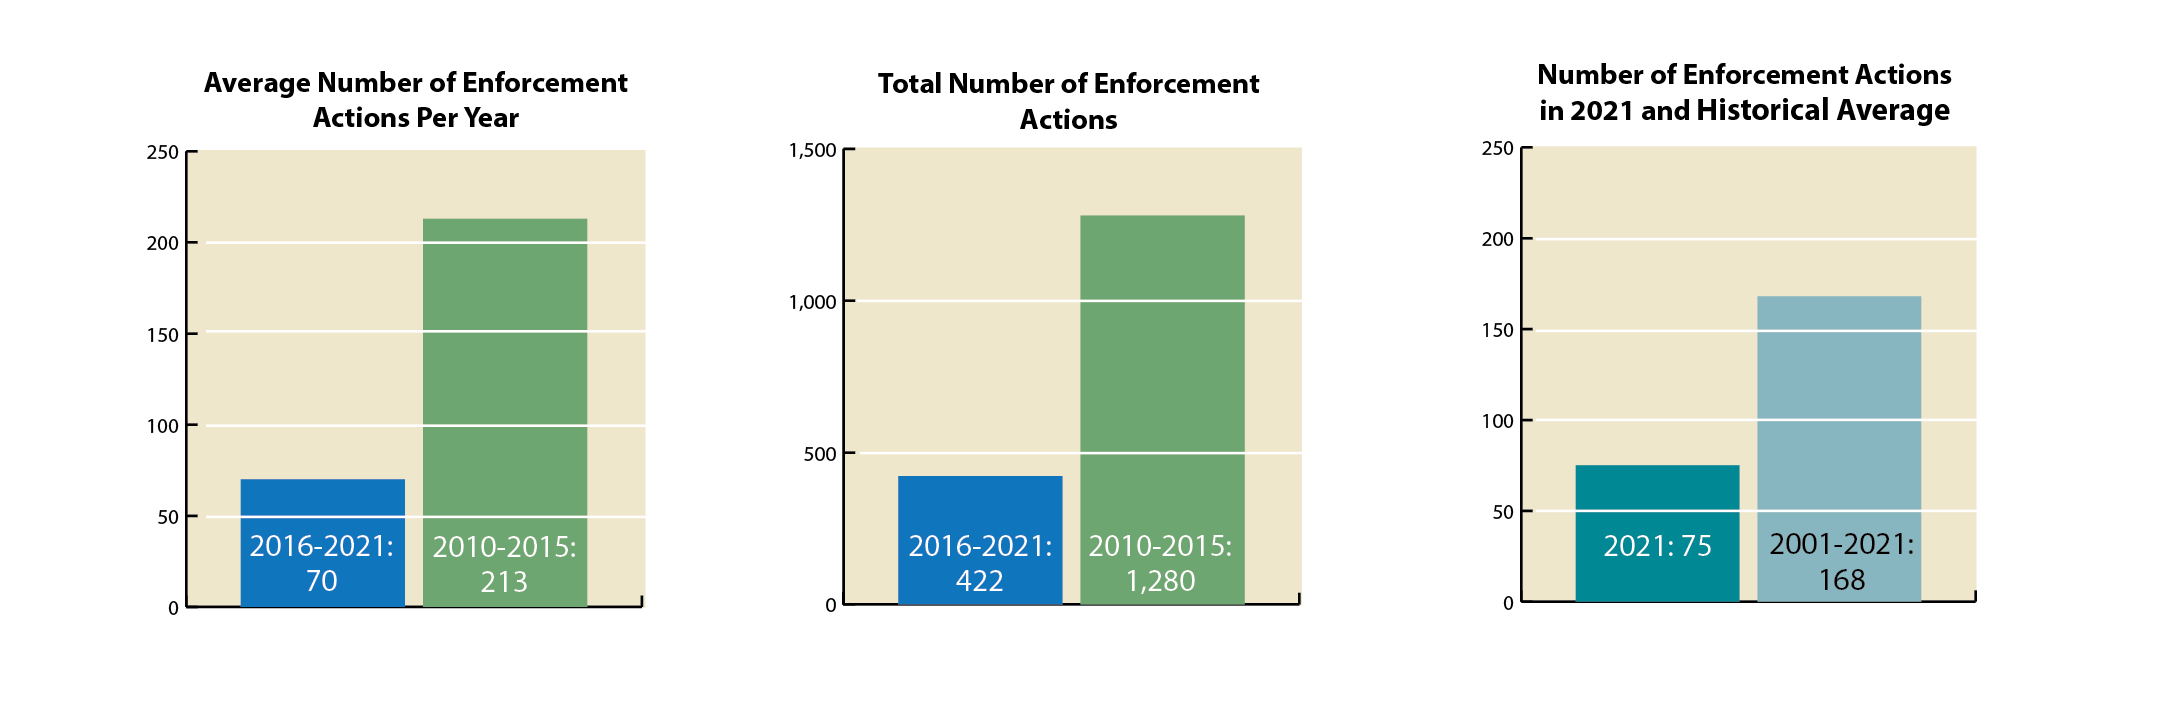
The Number of Enforcement Actions Taken by WSA
One of the most direct ways to measure MDE’s water-related enforcement levels is to look at the overall number of enforcement actions taken by MDE’s Water & Science Administration (WSA). There are a wide number of enforcement actions that WSA can take against a facility for significant and non-significant violations such as issuing stop-work orders, requiring corrective actions, obtaining injunctive relief, issuing penalties, referring pollution violations to the Attorney General for civil and criminal action, among others. Enforcement actions encourage polluters to stay in line with the requirements of the law.

- Overall, from FY2016 through FY2021, WSA took 67 percent fewer water-related enforcement actions than it took from FY2010 through 2015.
- In FY2021, WSA took 55 percent fewer water-related enforcement actions than WSA’s historical average.
|
WSA has increasingly delegated enforcement responsibilities to local jurisdictions, but without increasing either financial support for, or ensuring sufficient oversight over, local agencies. The enforcement data reported by local agencies to WSA show abysmal levels of enforcement for construction and development related pollution violations, despite thousands of complaints being filed each year, according to state data According to data reported by local agencies, concerned residents filed 3,344 complaints over the last two years and inspections identified 18,548 violations of erosion and sediment control or grading permits. However, less than eight percent of violations resulted in either a stop work order or penalty. The penalties issued amounted to about $20 per violation identified. With such low levels of enforcement and weak penalties, it is no wonder the number of violations is so high. |
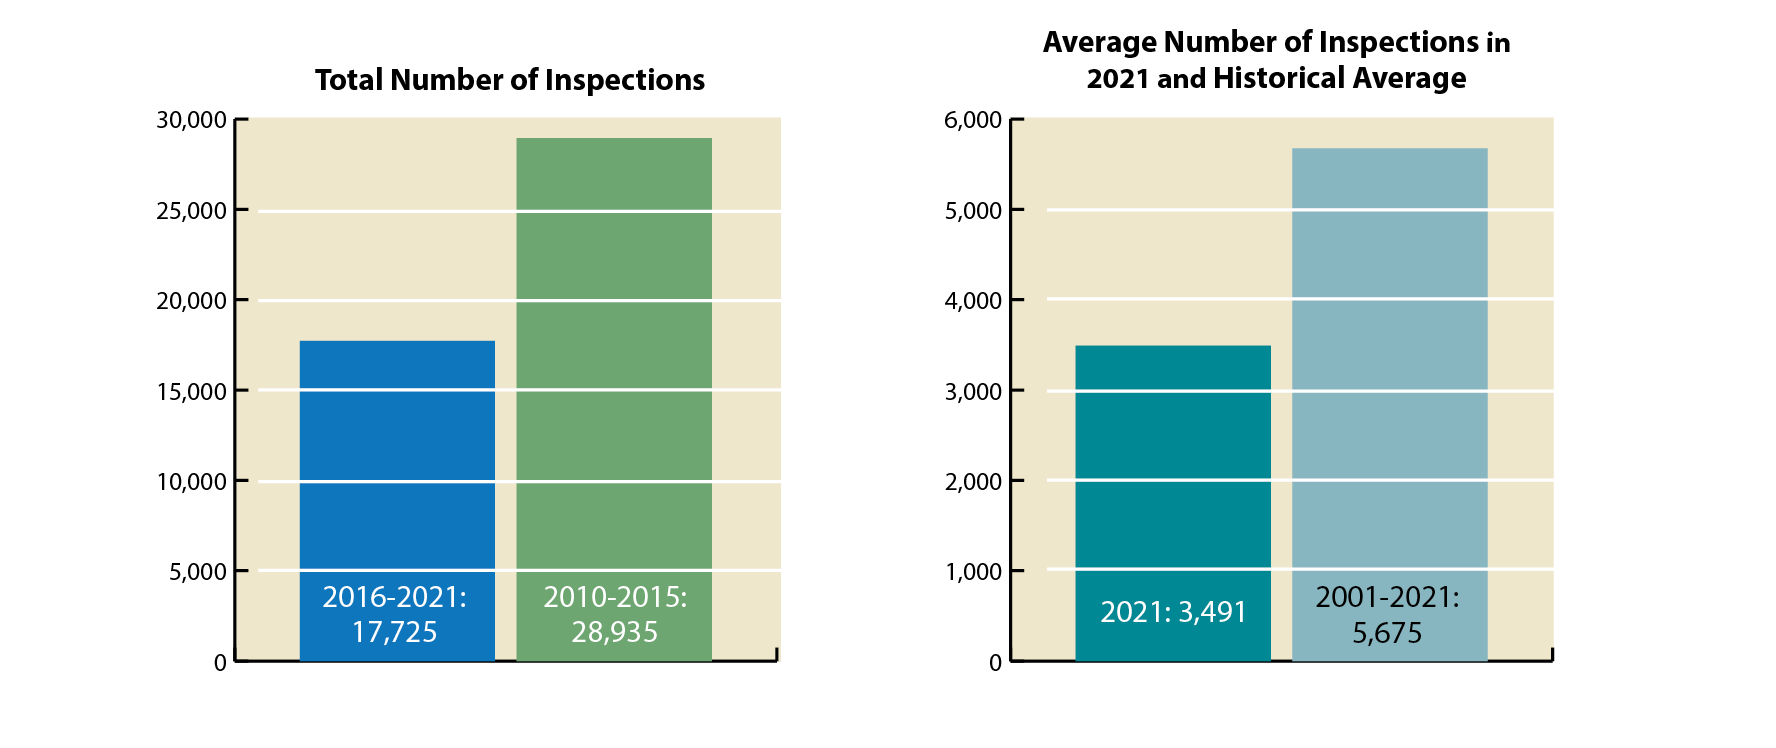
The Number of Water-Related Inspections Conducted by WSA
The number of inspections conducted by WSA is a key indicator for how the department monitors compliance with important environmental protections. Inspections involve WSA staff visiting facilities or sites to assess whether a facility or site is in compliance with the law. WSA staff do so by collecting samples, taking photographs, interviewing employees, reviewing records and reports, and observing the overall operations or conditions.
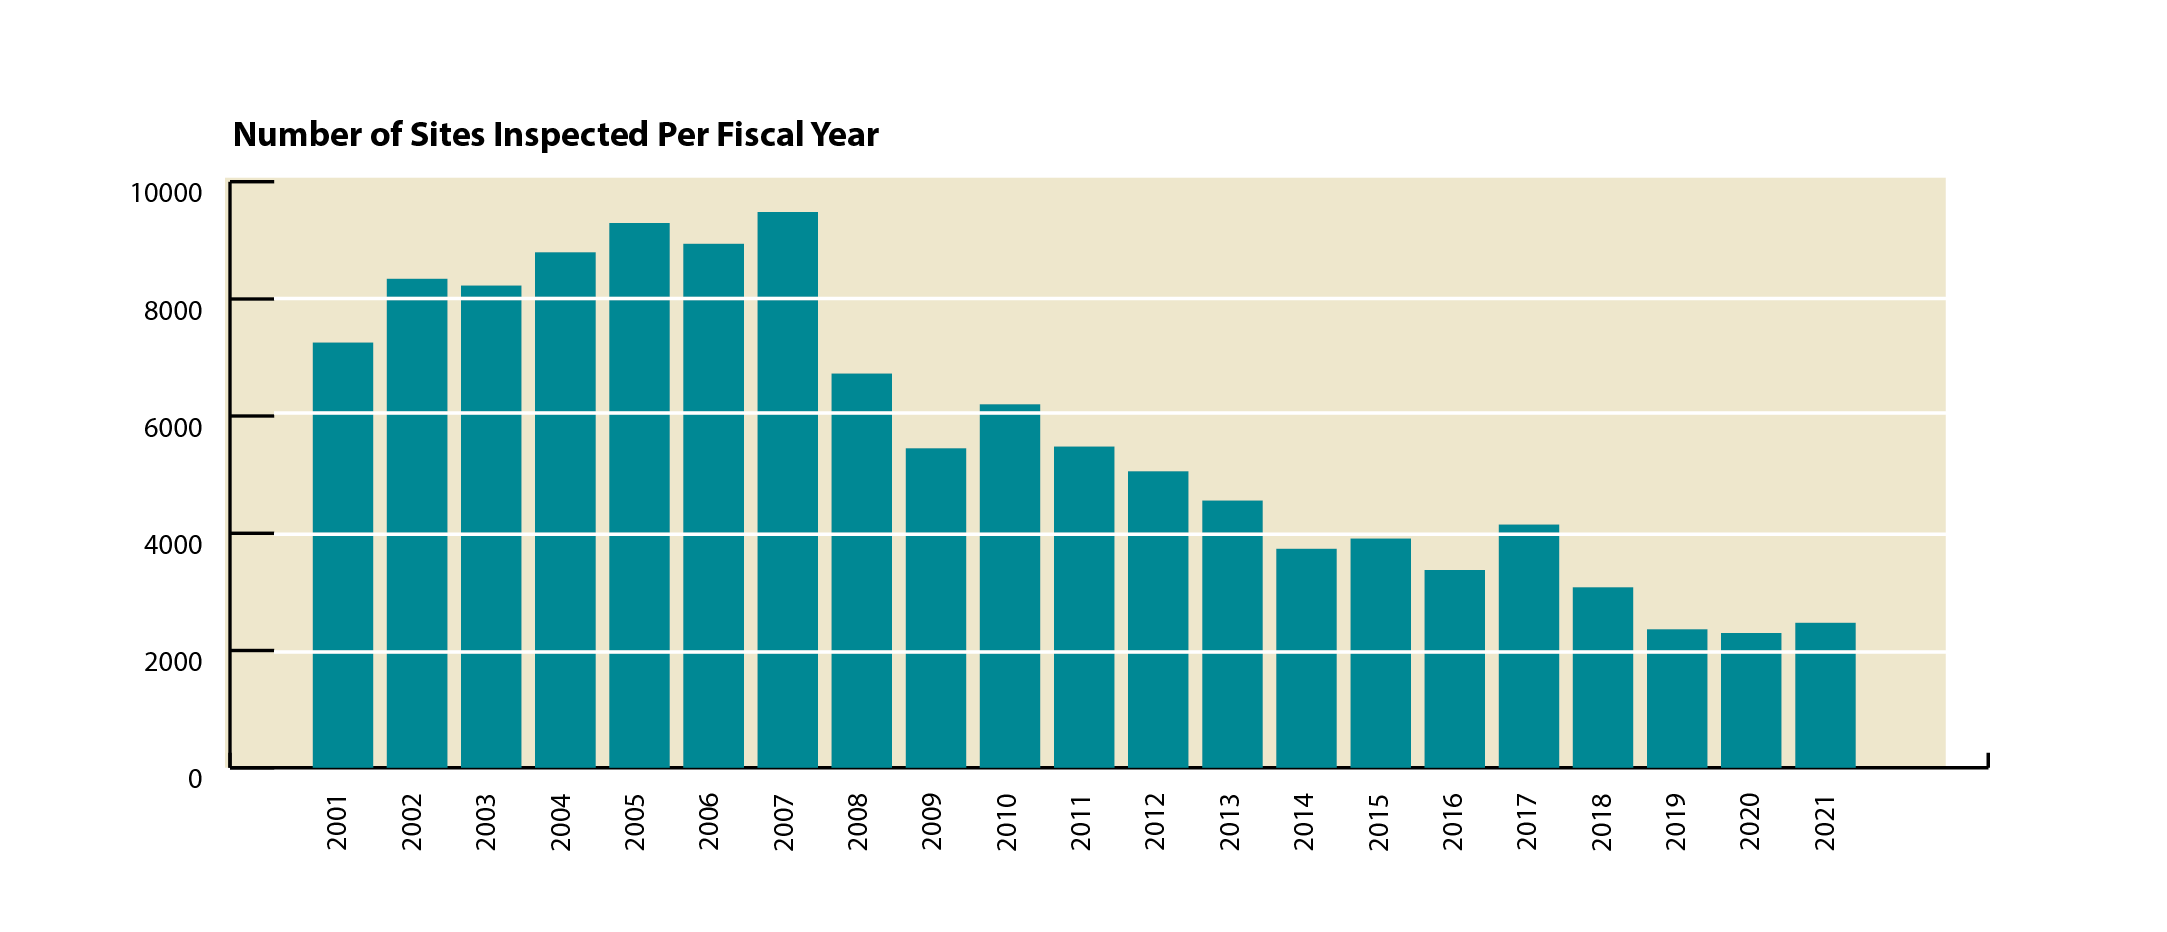
- Overall, from FY2016 through FY2021, WSA inspected 39 percent fewer water-related sites than it took from FY2010 through 2015.
- In FY2021, WSA inspected 38 percent fewer water-related sites than WSA’s historical average.
| In FY2020, WSA only inspected 2,296 water-related sites, a record low over the past two decades. The record high number of sites inspected occurred in FY2007, with 9,483 sites. While MDE cited the pandemic for its low number of inspections in FY2020 (July 1, 2019 - June 30, 2020), the pandemic should have only impacted roughly one quarter of WSA’s overall numbers, with from FY2016 through FY2021, State of Emergency declaration on March 5, 2020. |
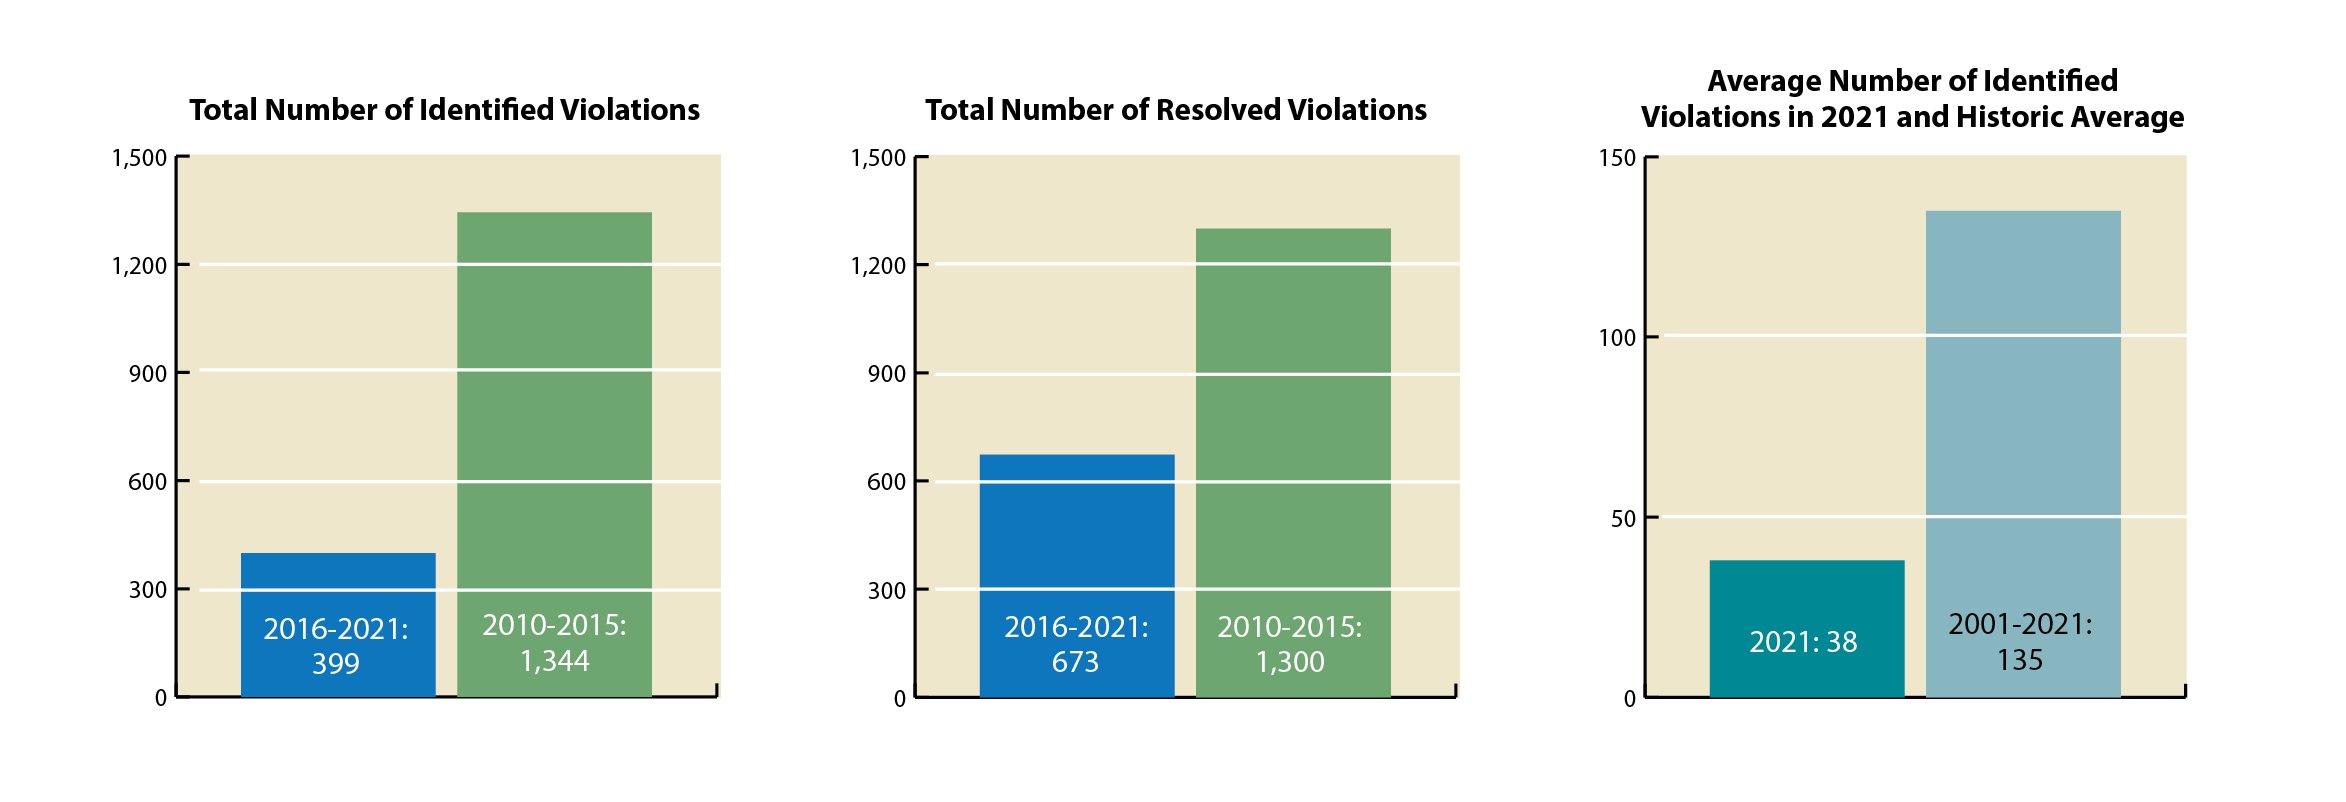
The Number of Water-Related Significant Violations Identified and Resolved by WSA
The number of significant violations identified by WSA is a good indicator of how aggressive the department is in pursuing serious pollution violations. The Maryland Department of the Environment generally defines a significant violation as one that requires some form of remedial or enforcement action to assure compliance with environmental protections. This does not include the actual number of significant water-related ‘violations’ that are not pursued by WSA, go undetected, or are not self-reported. In other words, just because there is a decrease in significant violations identified by WSA does not mean there is a decrease in pollution.
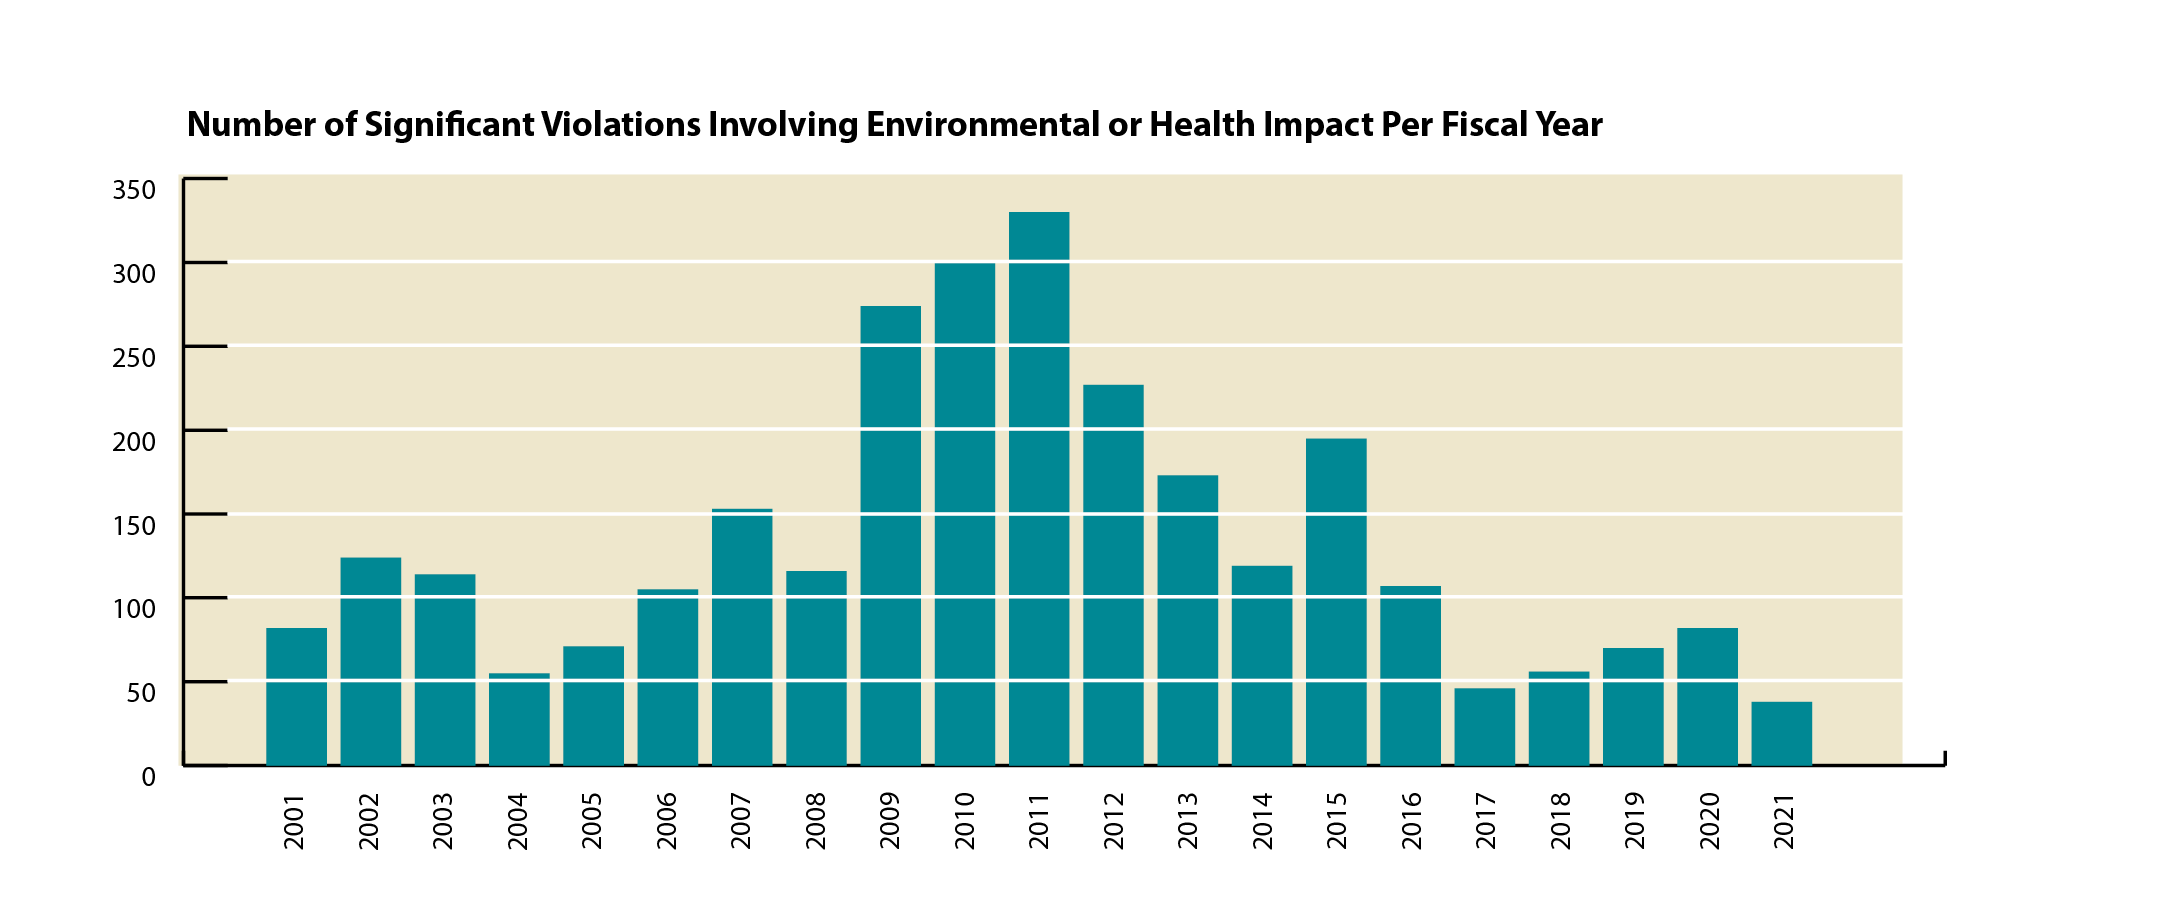
- Overall, from FY2016 through FY2021, WSA identified 70 percent fewer significant violations involving environmental or health impacts than it took from FY2010 through 2015.
- Overall, from FY2016 through FY2021, WSA resolved 48 percent fewer significant violations than it took from FY2010 through 2015.
- In FY2021, WSA identified 72 percent fewer significant violations involving environmental or health impacts than WSA’s historical average. This number is a record low over the past two decades.
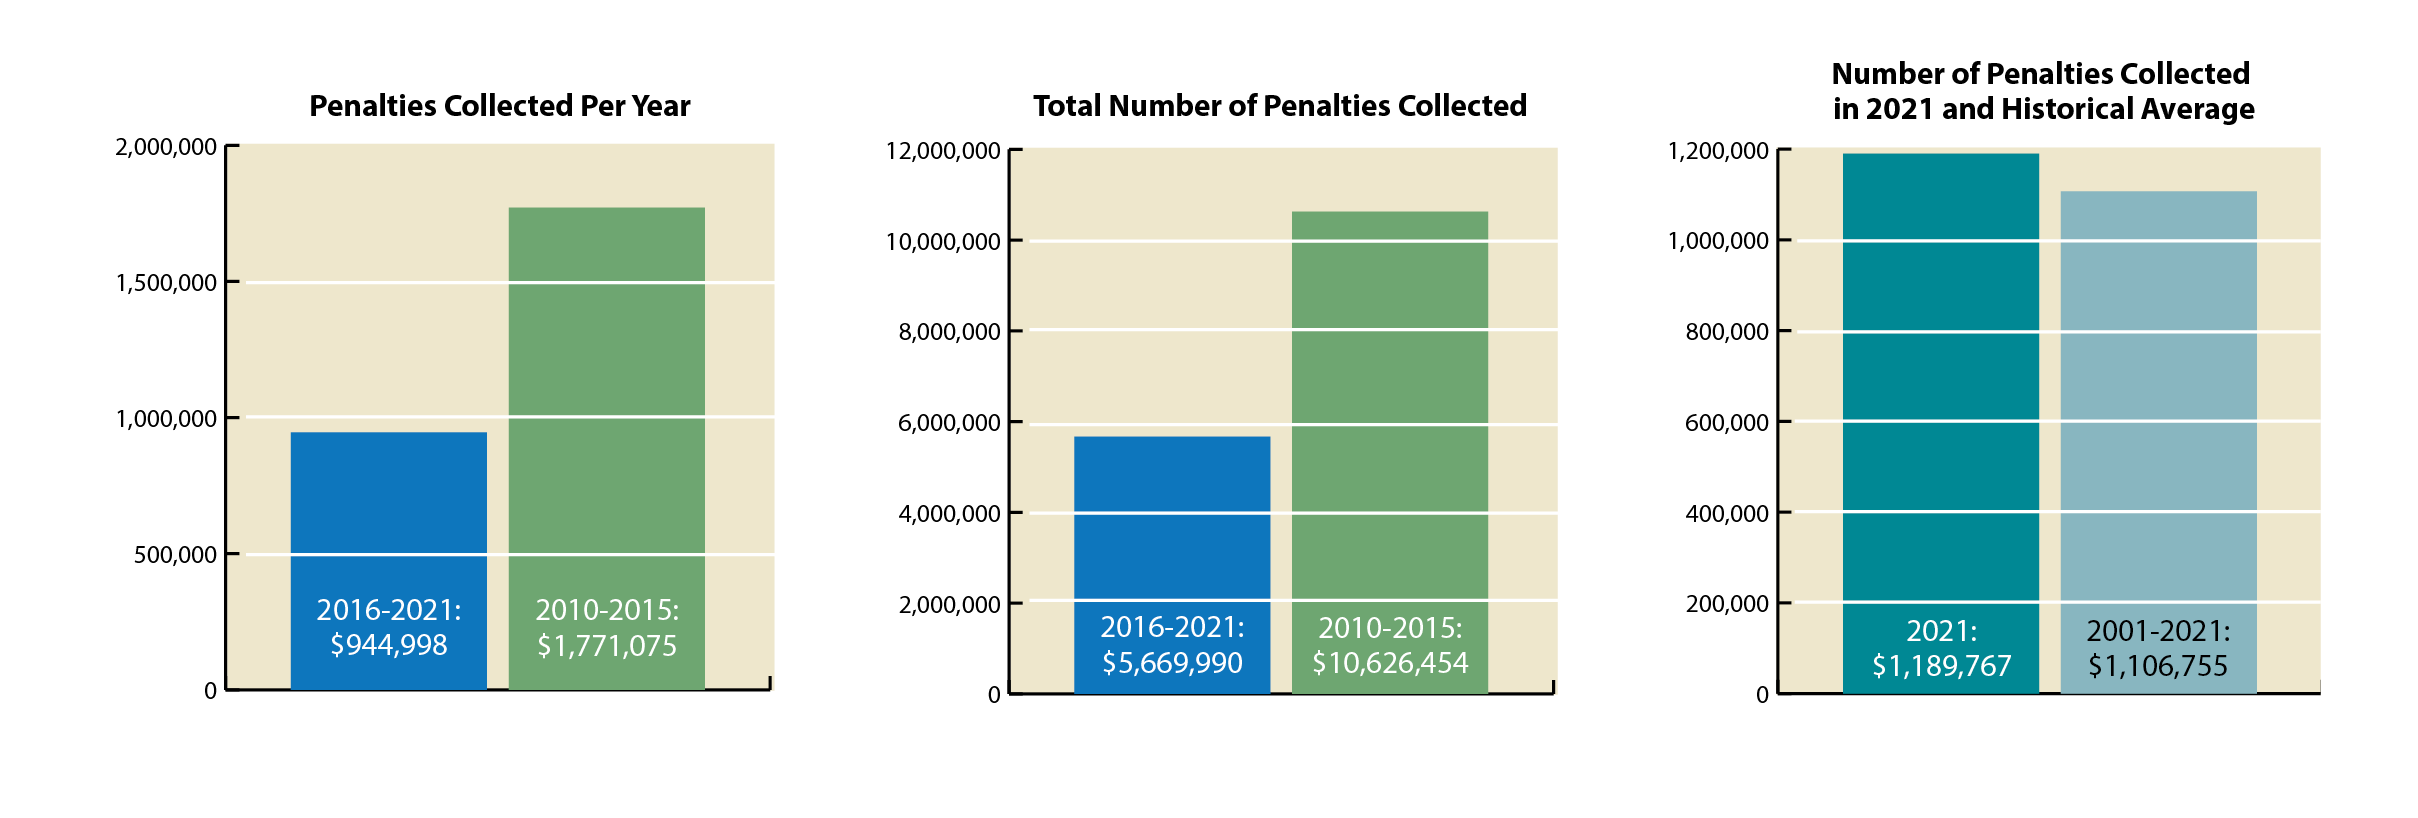
The Number of Water-Related Penalties Collected by WSA
While the number of water-related penalties (adjusted for inflation, as measured by the Consumer Price Index) collected by WSA varies dramatically based on the nature, amount, and severity of violations resolved by various enforcement and legal actions against violators (much of which is outside of the control of WSA), this number gives some sense of the Department’s willingness to collect penalties from violators as a way to enforce environmental protections.
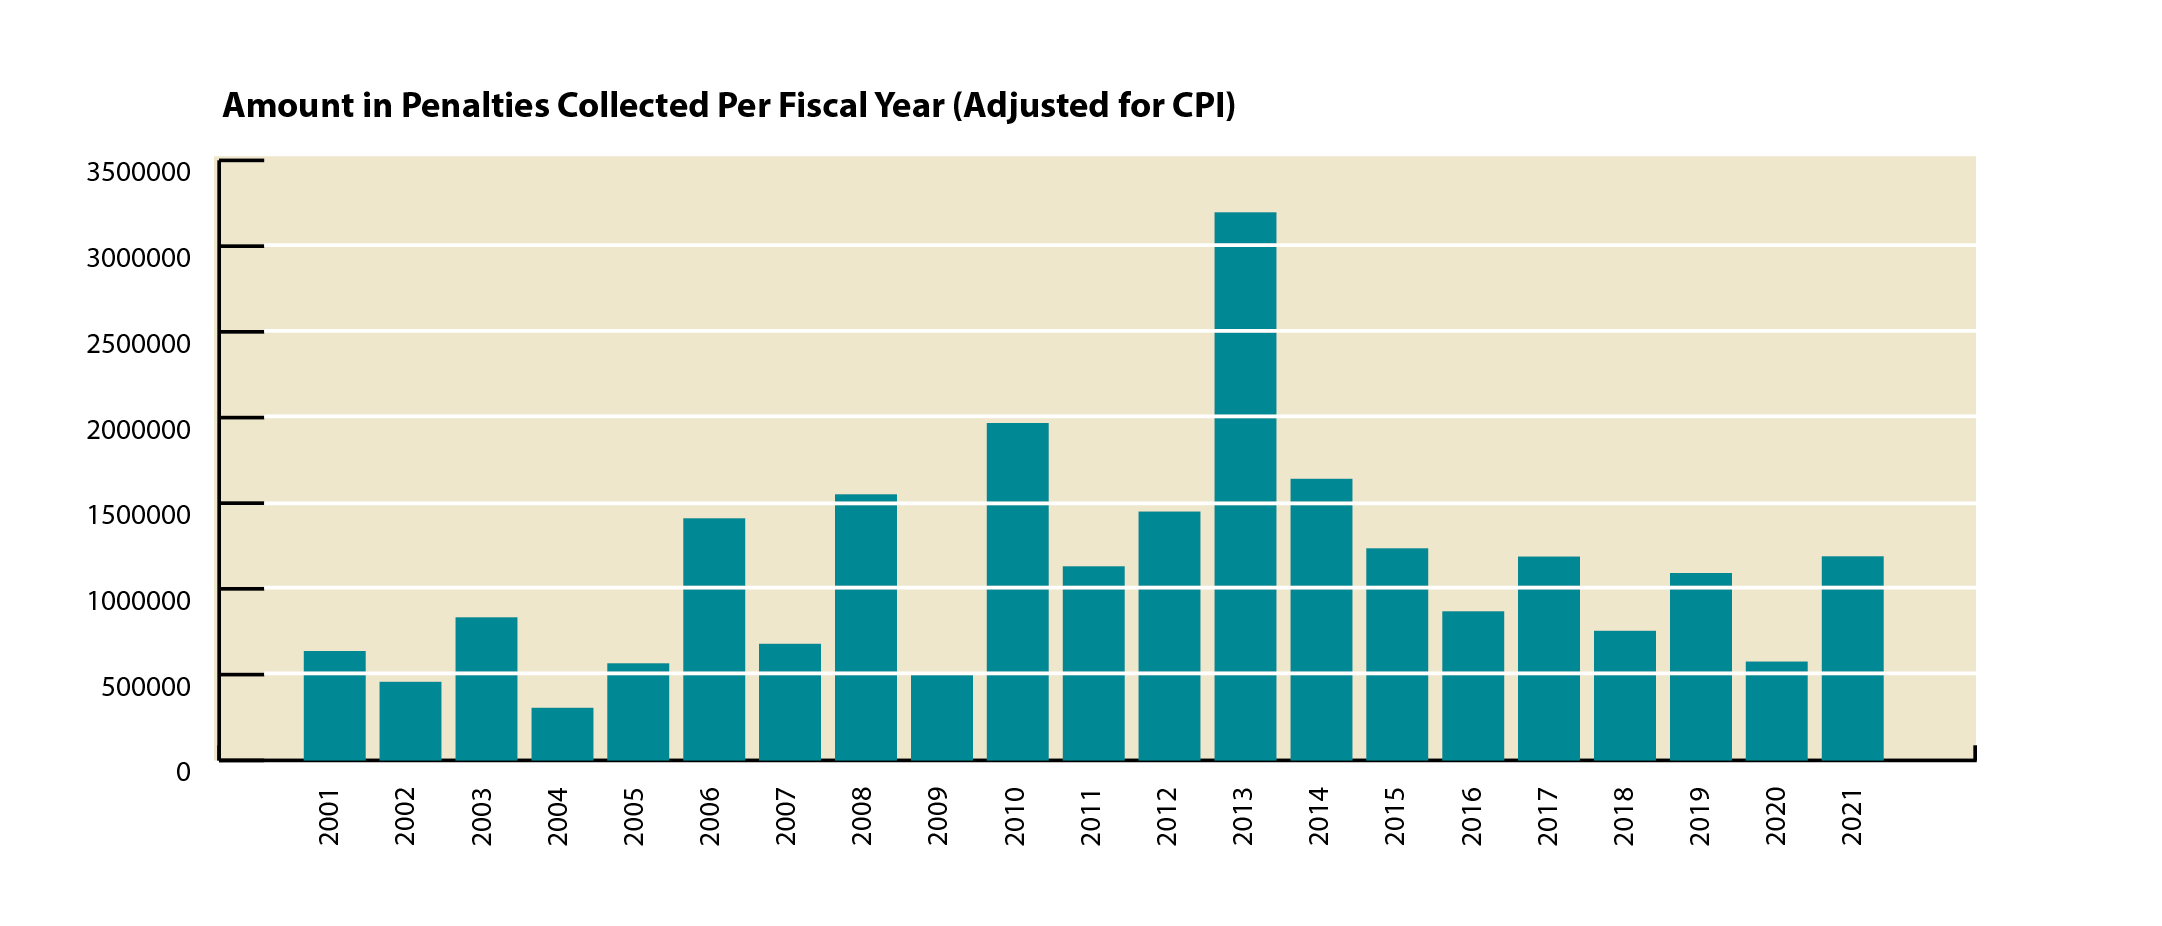
- Overall, from FY2016 through FY2021, WSA collected 47 percent less in water-related penalties than it took from FY2010 through 2015.
- In FY2021, WSA collected eight percent more in water-related penalties than WSA’s historical average.
The Number of Water-Related Compliance Assistance Rendered
Under Governor Hogan's administration, the MDE prioritized so-called “compliance assistance”[1] as its principal enforcement policy for addressing ‘minor’ violations before they turn into significant violations. However, WSA’s implementation of its compliance assistance program leaves major questions about its effectiveness at resolving violations. According to MDE, compliance assistance is considered “rendered” when the non-compliant facility or entity sends written documentation that the correction has “been made or commenced.” While compliance assistance can sometimes lessen the environmental impacts of certain violations, it’s unclear whether MDE verifies the written documentation in any way. It’s also unclear how many facilities or entities that submit documentation have actually come into compliance as a result of any corrections made or commenced and how many of those facilities stay in compliance.
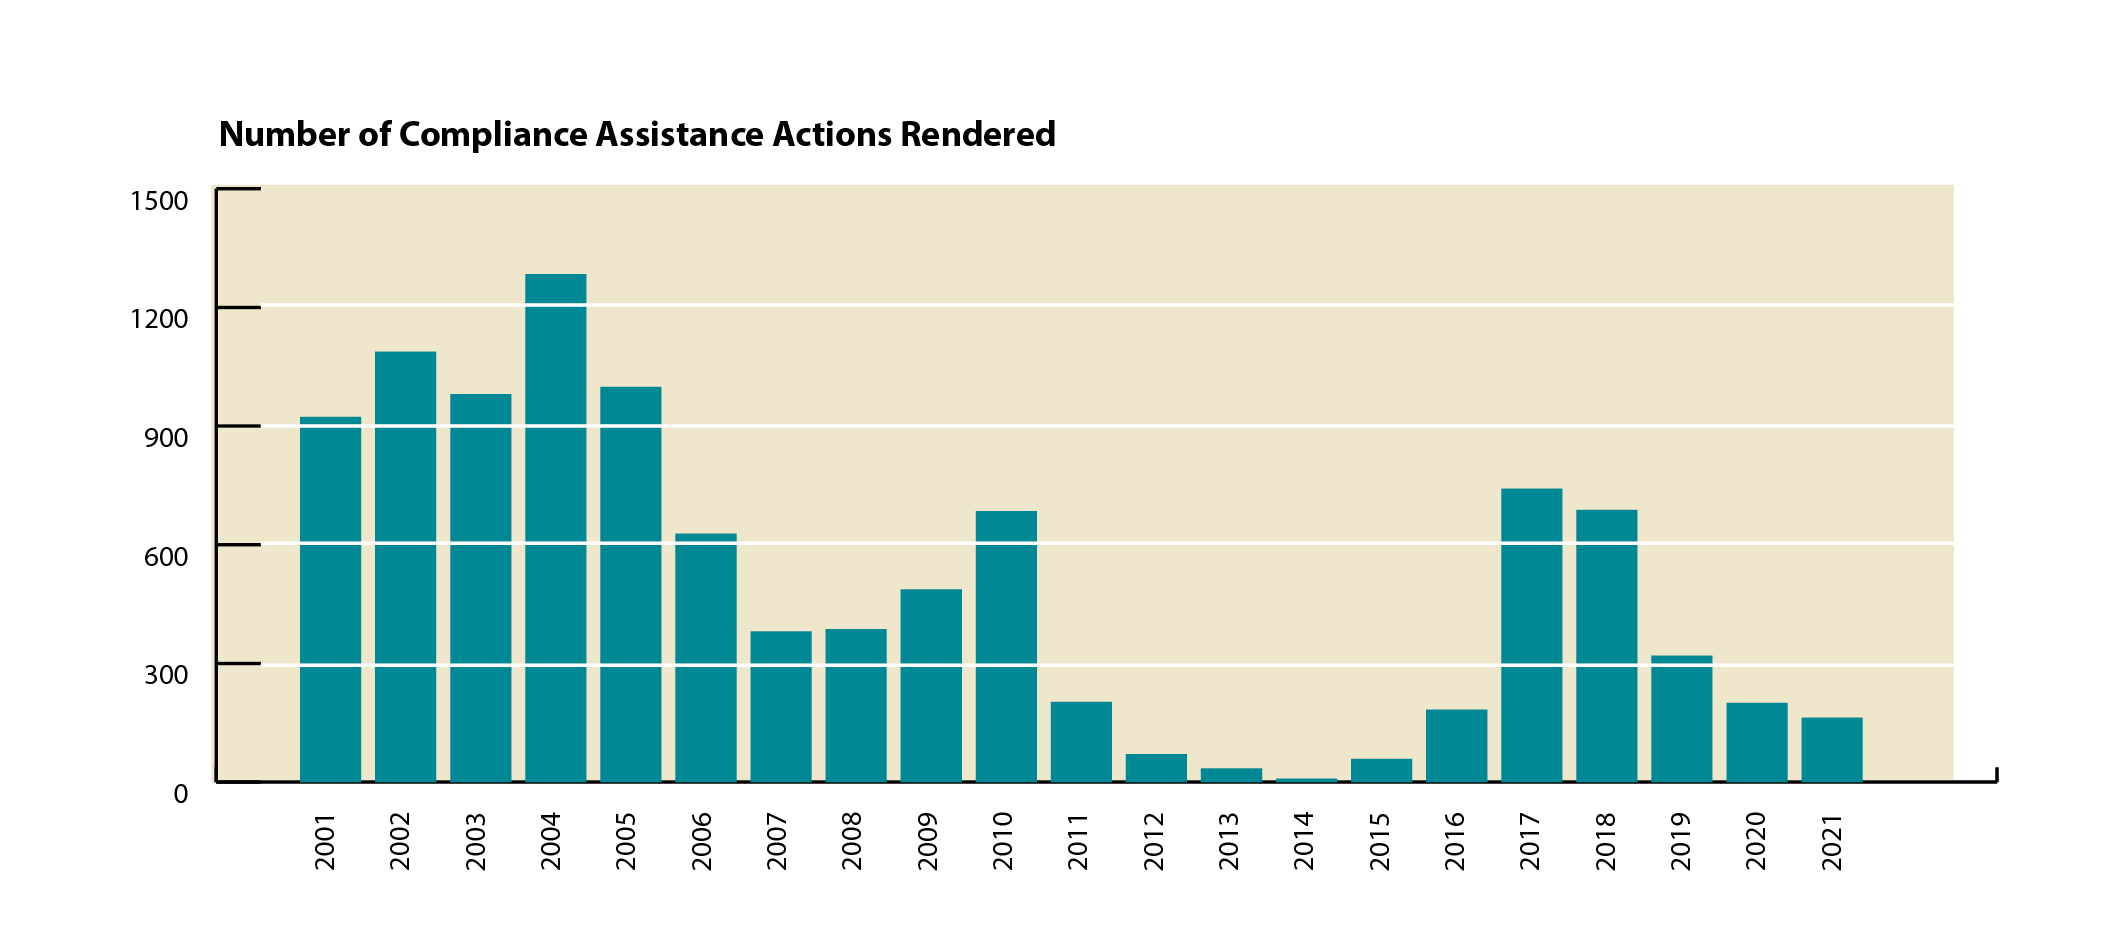
- Overall, from FY2016 through FY2021, WSA rendered 116 percent more compliance assistance than it took from FY2010 through 2015.
- In FY2021, WSA rendered 67 percent less compliance assistance than WSA’s historical average.

The MDE’s Capacity for Oversight and Enforcement
About: The Maryland Department of Environment’s capacity to enforce environmental laws and permits includes the number of active staff within the agency and the agency’s overall budget.
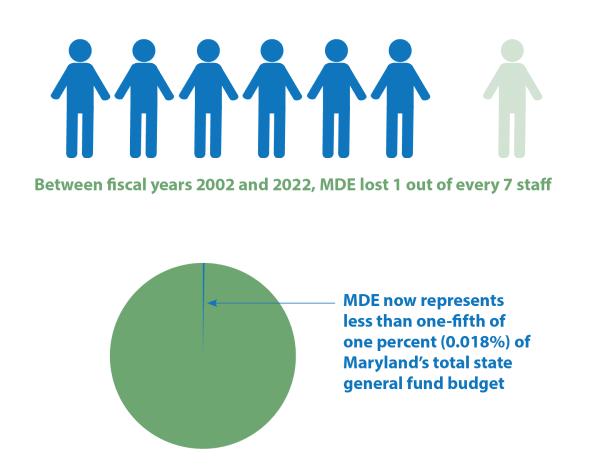
- In the two decades between fiscal years 2002 and 2022, MDE lost one out of every seven staff, with its agency budget of state general funds falling by more than one-third, adjusting for inflation. MDE now represents less than one-fifth of one percent (0.018%) of Maryland’s total state general fund budget, which is half of what it was two decades ago. At a time when protecting our environment is vitally important, MDE's budget has languished in the overall state budget.
[1] MDE’s Annual Enforcement & Compliance Report (2021) defines compliance assistance as “a process that turns to enforcement action if violations are uncorrected or environmental harm is threatened... Compliance assistance is used by MDE as one of the many tools to educate the regulated community before violations occur and - in the case of non-serious violations - to bring a site into compliance and to assure future compliance… As an element of MDE’s compliance process, an inspector renders a tangible act of compliance assistance when the inspector does one or both of the following: (a) Documents a specific past or current violation, which the regulated entity corrects in the absence of a formal enforcement action; or (b) Documents a specific action or actions, which the regulated entity has the option of undertaking to bring a site into compliance and to assure future compliance. The action or actions are voluntarily undertaken by the regulated entity in such manner and within such time period as deemed acceptable by MDE in the absence of a formal enforcement action.”